Okay, let’s be real for a second: when you hear “graph intercept,” your brain might try to run for the hills. But stick with me! Finding where a line kisses the x-axis or y-axis isn’t some secret math society ritual. It’s actually super simple—and kinda satisfying, like popping bubble wrap.
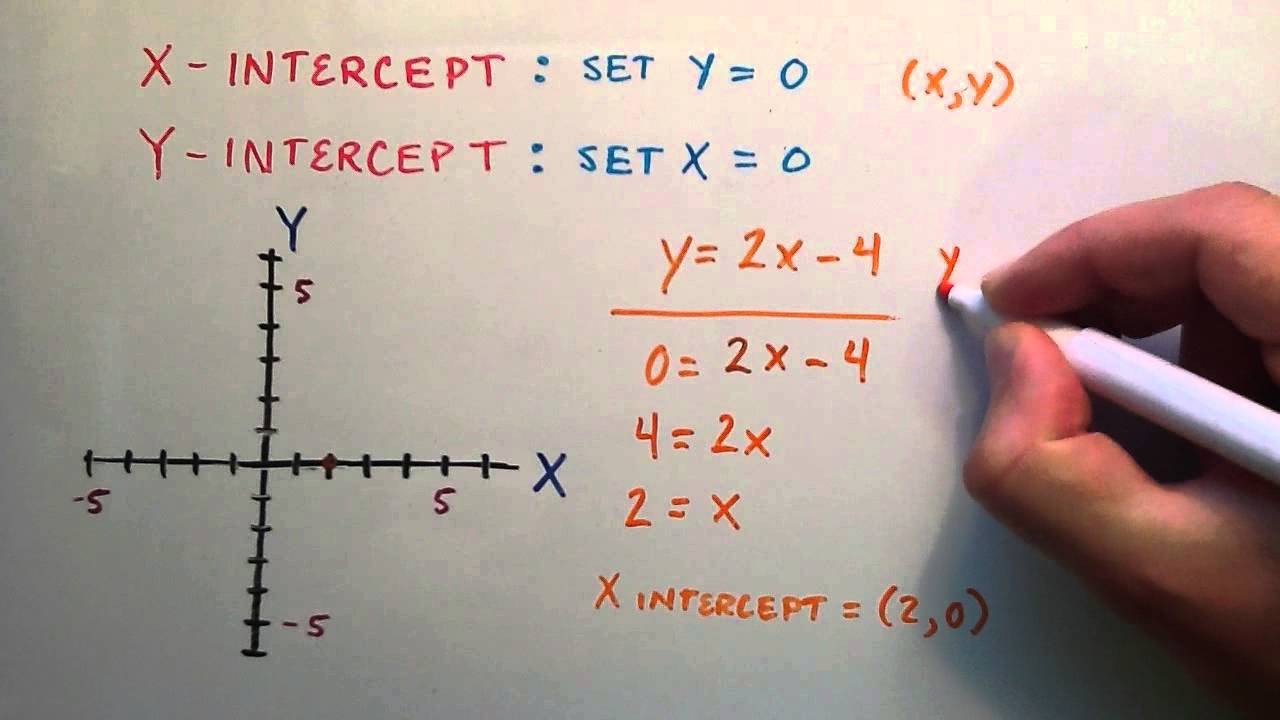
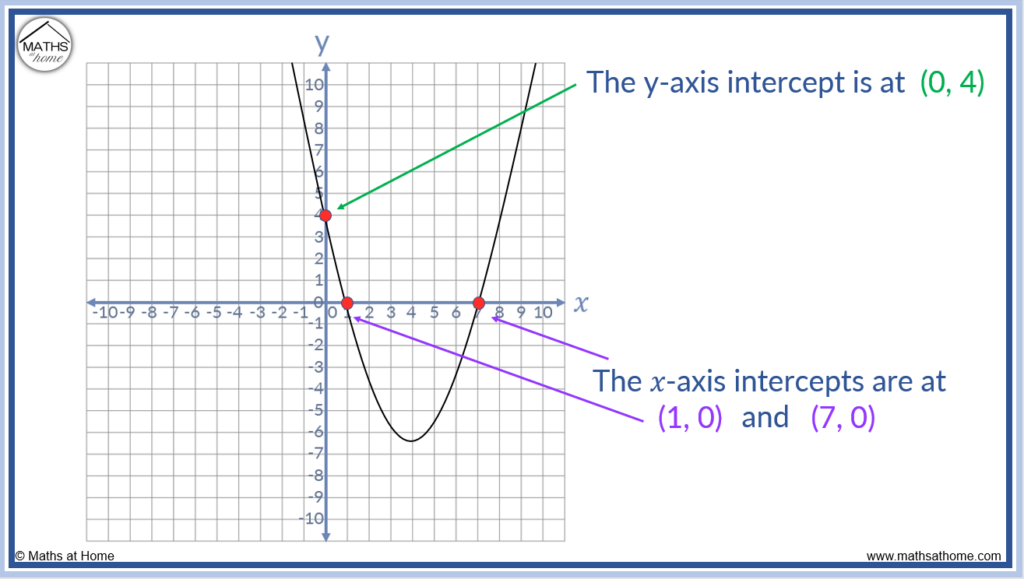
First, let’s define our friends. The y-intercept is where the line crosses the vertical y-axis. Look at that point: the x-coordinate is always zero. So if you have an equation like y = 2x + 3, just set x to zero. Poof! You get y = 3. That’s your y-intercept. Told you it was that easy.
Now, the x-intercept is where the line crosses the horizontal x-axis. Here, y is zero. Using the same equation, set y to zero: 0 = 2x + 3. Solve for x, and you get x = -1.5. That’s your point, (-1.5, 0). See? You just did algebra. Give yourself a little high-five—no one’s watching.
More to explore
For you visual learners with a graph in front of you: just trace the line with your finger. Where it hits the y-axis? Boom, y-intercept. Where it hits the x-axis? Magic, x-intercept. If the line is being shy and parallel to an axis, don’t panic—it might not have that intercept. That’s not your problem; it’s the line’s drama.
And remember: intercepts are like the address of your line’s landmarks. They tell you where it starts and where it lands. Mastering this won’t just help you pass a quiz—it’ll make you feel like a detective who cracked the case. You’ve got this. Now go find those intercepts like the graphing guru you were always meant to be. Smile—you just made math your friend.